02 · Monitor
See every flow, every site, in real time.
Once data is flowing, Monitor is where your team lives. Three utilities on one pane: electricity, gas and water, normalised across timezones, currencies and tariffs, at site and portfolio level.
Most platforms force you to choose: electricity-only with the deepest visualisation, or multi-utility with a generic dashboard. Wia gives you both. Scope 1 needs gas. Benchmarking needs all three. Reporting needs everything tied to the right period, the right tariff, the right tenant.
How Monitor works
From meter to live dashboard.
01
Connect
Once data is flowing from Ingest, every meter is normalised against your site context: currency, timezone, tariff, working hours. The same kWh figure in Stockholm and São Paulo lands as the same kWh figure in your portfolio view.
02
Configure
Set working hours per site, per shift pattern. Define which meters are tenant-billable. Configure tariff windows. Wia learns the patterns and surfaces deviations.
03
Live across the portfolio
Every team member sees the same numbers, refreshed as readings arrive, down to one-minute intervals. Drill from portfolio → region → site → meter without switching dashboards. Bookmark any view and share with a URL.
One-minute data
Down to the minute.
At one minute you see what a quarter-hour average smooths away: start-up surges, plant that short-cycles, and the exact minute a schedule failed to switch a building off.
Inside Monitor
Everything Monitor does, in one place.
Summary
Single view of the site or portfolio: cost, carbon, status, outdoor temperature, data completeness. The first screen your team opens every morning. Drill into any tile for the underlying period and series.
Consumption
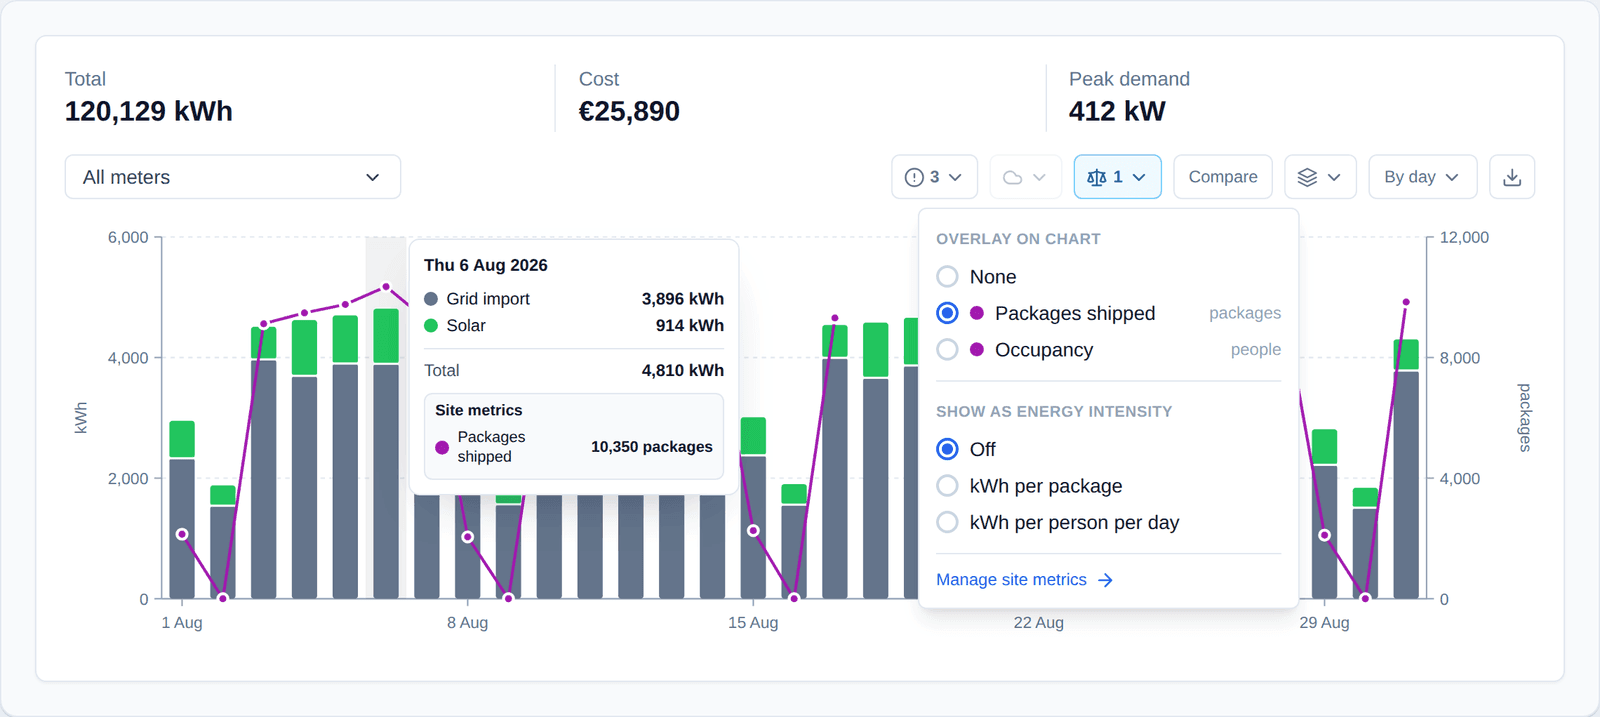
Every utility, every period, with period-over-period comparison. Grid, solar, production and export split out so you can see what was bought, what was generated and what was sent back. Compare against tariff, weather, occupancy.
Production
Solar yield, on-site generation and export to grid. Per-period kWh and cost-avoided modelling, including self-consumption ratio and curtailment events. Per-string monitoring where the inverter exposes it.
Out-of-hours
What's drawing power when nobody should be, flagged automatically against configurable working hours. Per site, per asset, per shift pattern. Output rolls up to a portfolio-level out-of-hours metric for the board.
Multi-utility from day one.
Most competitors do electricity. Wia does all three, because Scope 1 needs gas and benchmarking needs all three.
KPIs and targets
Every site measured the same way.
Energy intensity, cost, carbon, out-of-hours share and data completeness are defined once and calculated the same way for every site, then rolled up by country and portfolio. Set a target against a baseline year and Wia shows which sites are on track and which are drifting.
Site metrics
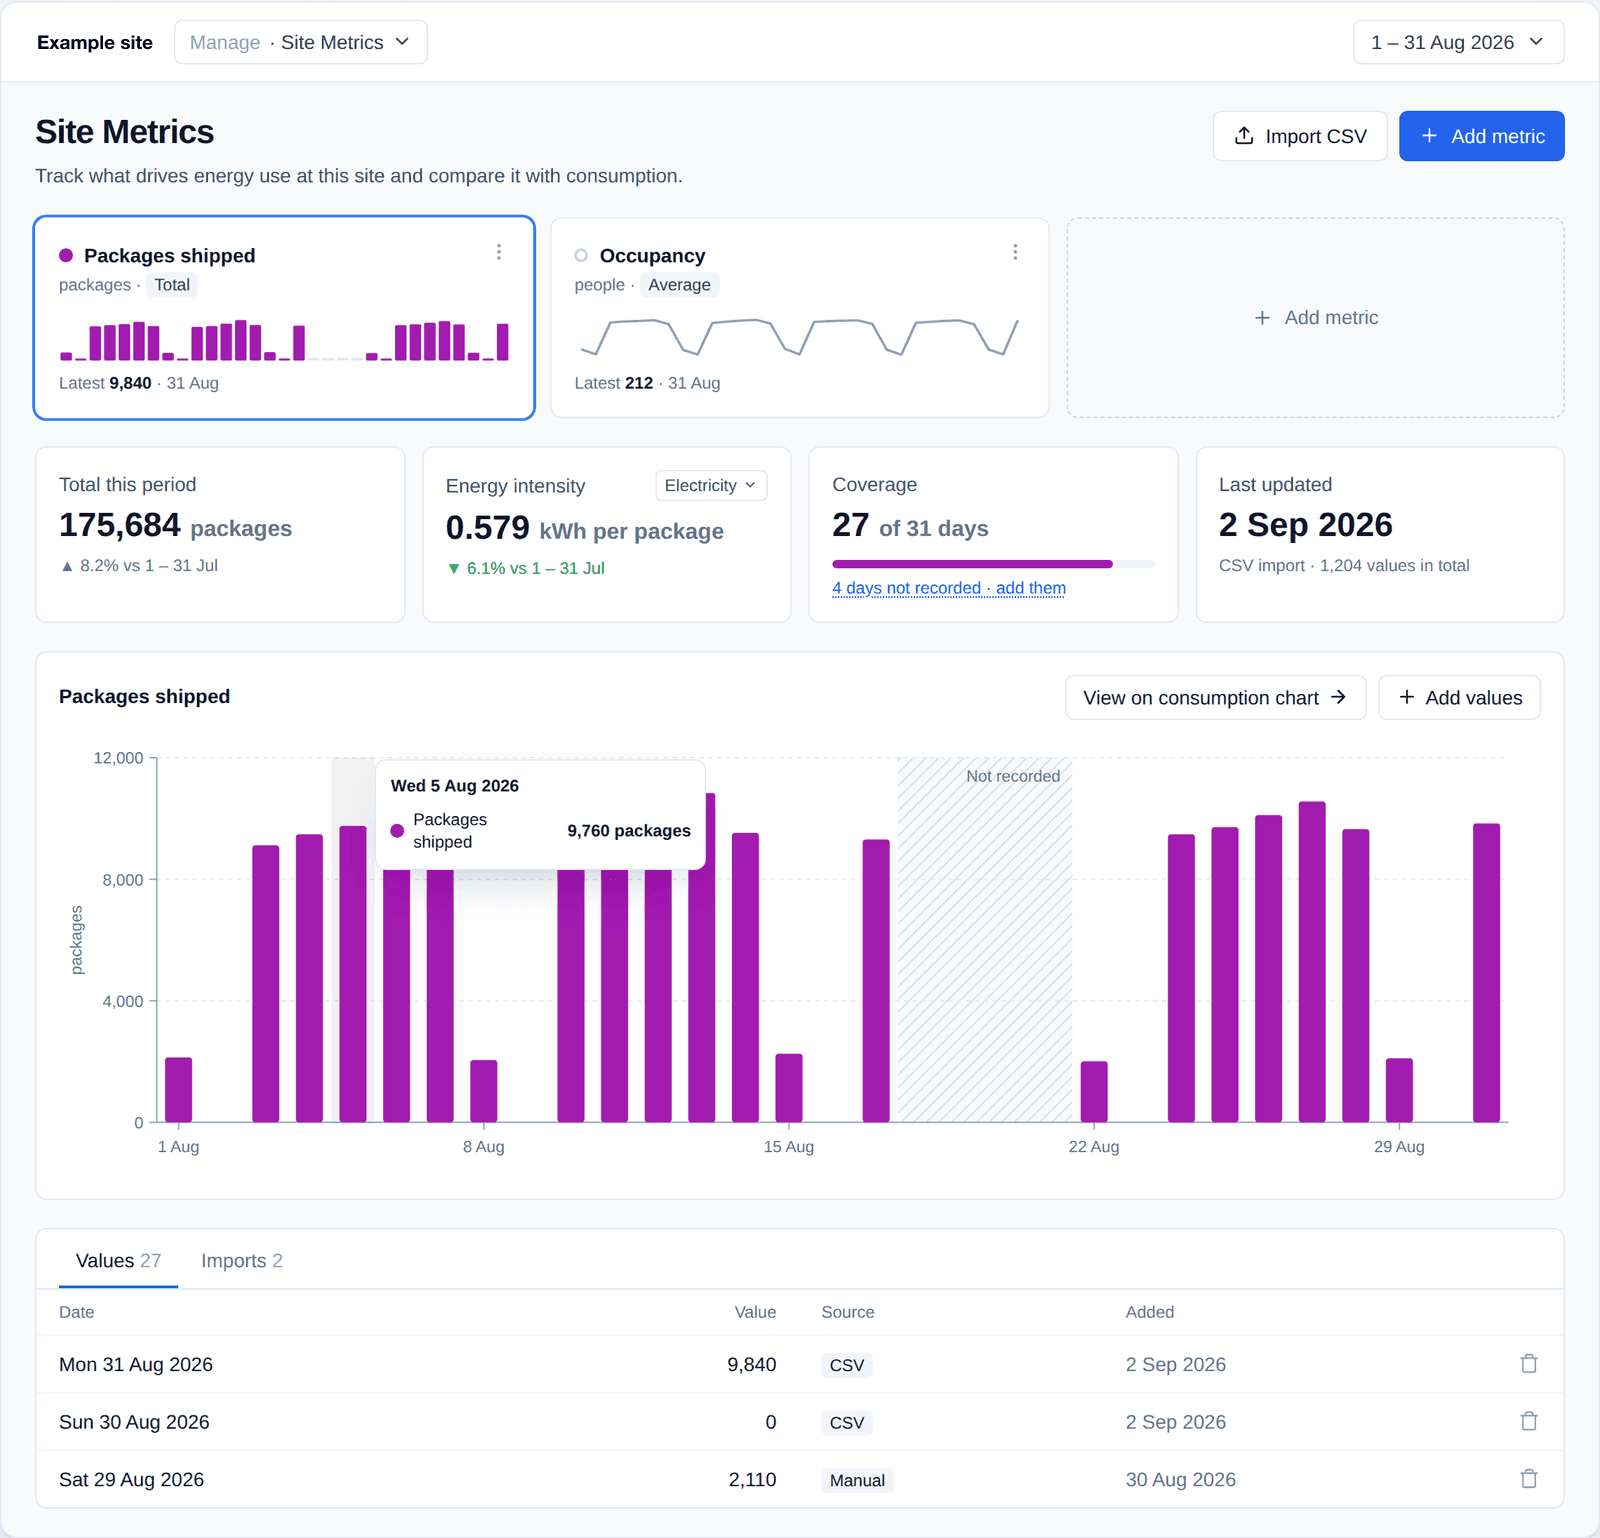
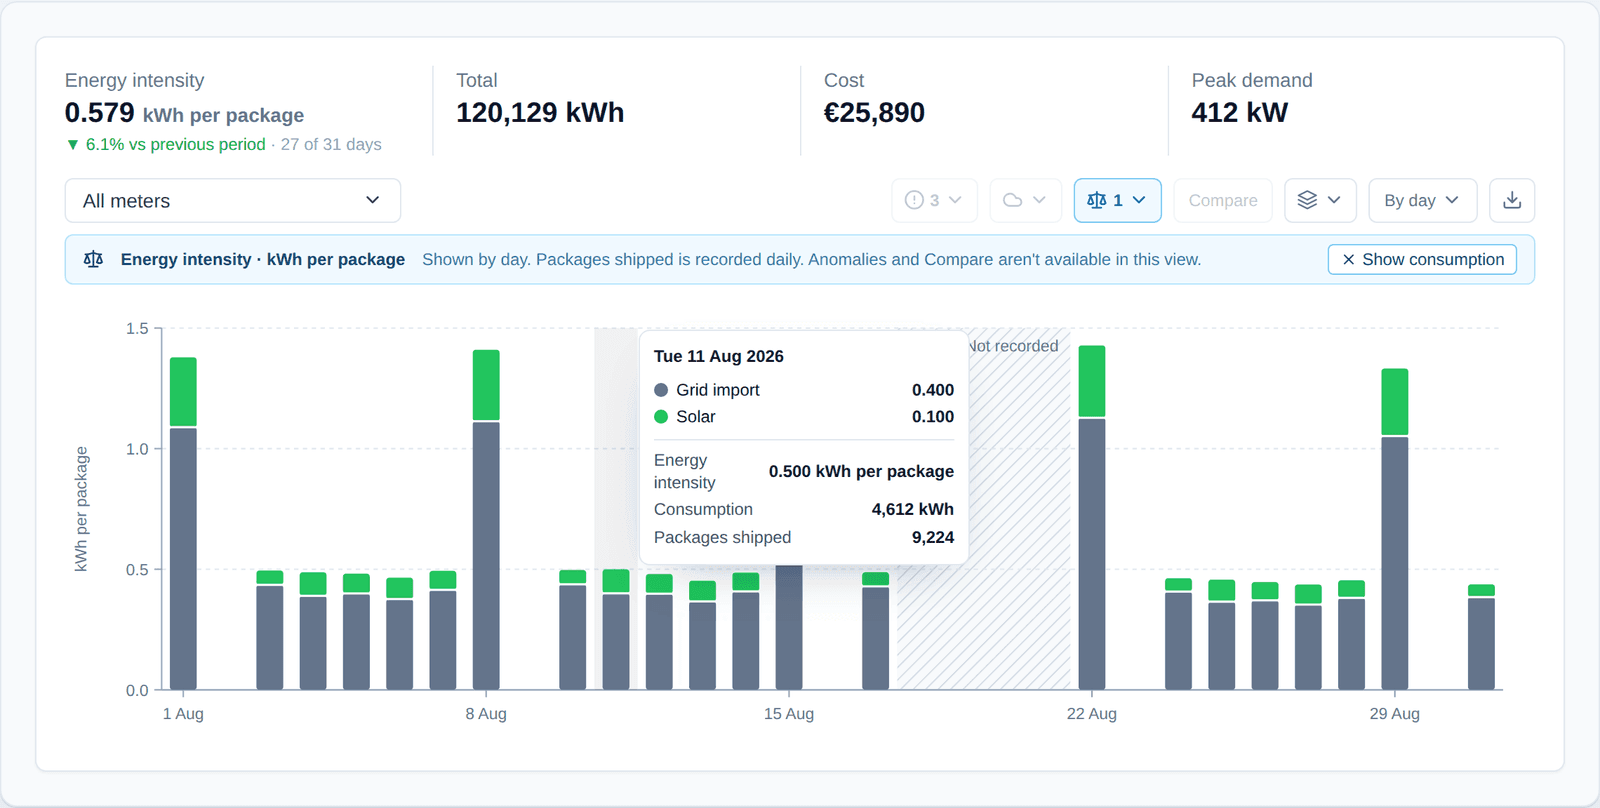
Record what drives each site’s energy, such as packages shipped, pallets moved, occupancy or footfall, by CSV import or by pasting a column from a spreadsheet. Wia then shows energy intensity per unit, so a busy month is never mistaken for a wasteful one.
Out-of-hours
What's on at 3am should be the question, not a discovery.
Out-of-hours waste is the single largest source of avoidable consumption in commercial buildings. Wia identifies it automatically against your configured working hours, per site and per shift pattern, and rolls the metric up to portfolio level. An example week: working-hours load, out-of-hours load and critical out-of-hours load.
Configure once. The heatmap, alerts and out-of-hours line item appear automatically in every report.
Works with
Your existing data stack.
Monitor is the live view. The underlying data flows to wherever your team needs it.
BI tools
- Power BI
- Tableau
- Looker
- Metabase
- Hex
- Google Data Studio
Data warehouses
- Snowflake
- BigQuery
- Databricks
- Postgres
- Redshift
Alerting & ops
- Slack
- Microsoft Teams
- PagerDuty
- Webhooks
FAQ
Common questions
How does Monitor handle daylight savings and timezone changes?
All readings are stored in UTC and rendered in the site's local timezone. Working-hours rules respect DST automatically. Out-of-hours behaviour around the clock change is flagged with a note rather than mis-classified.
Can different teams see different sites?
Yes. Role-based access is configurable down to the site or meter level. A real-estate operator can give each asset manager visibility into only their portfolio, with the head office seeing the whole estate.
How do tariffs flow through?
Tariffs are configured per meter, with support for time-of-use windows, capacity charges and indexed pricing. Cost lines in the dashboard always reflect the contractual tariff, not an average.
What's the data cadence?
Wia records data down to one-minute intervals where the meter supports it, and rolls it up to 15-minute, hourly, daily and monthly views automatically. BMS integrations report at the cadence your BMS is polled; invoice and manual data land per upload.
Want to see this on your data?
Bring your portfolio and we'll spin up a live view in the demo.
Request a demo